Different Ways Infographic
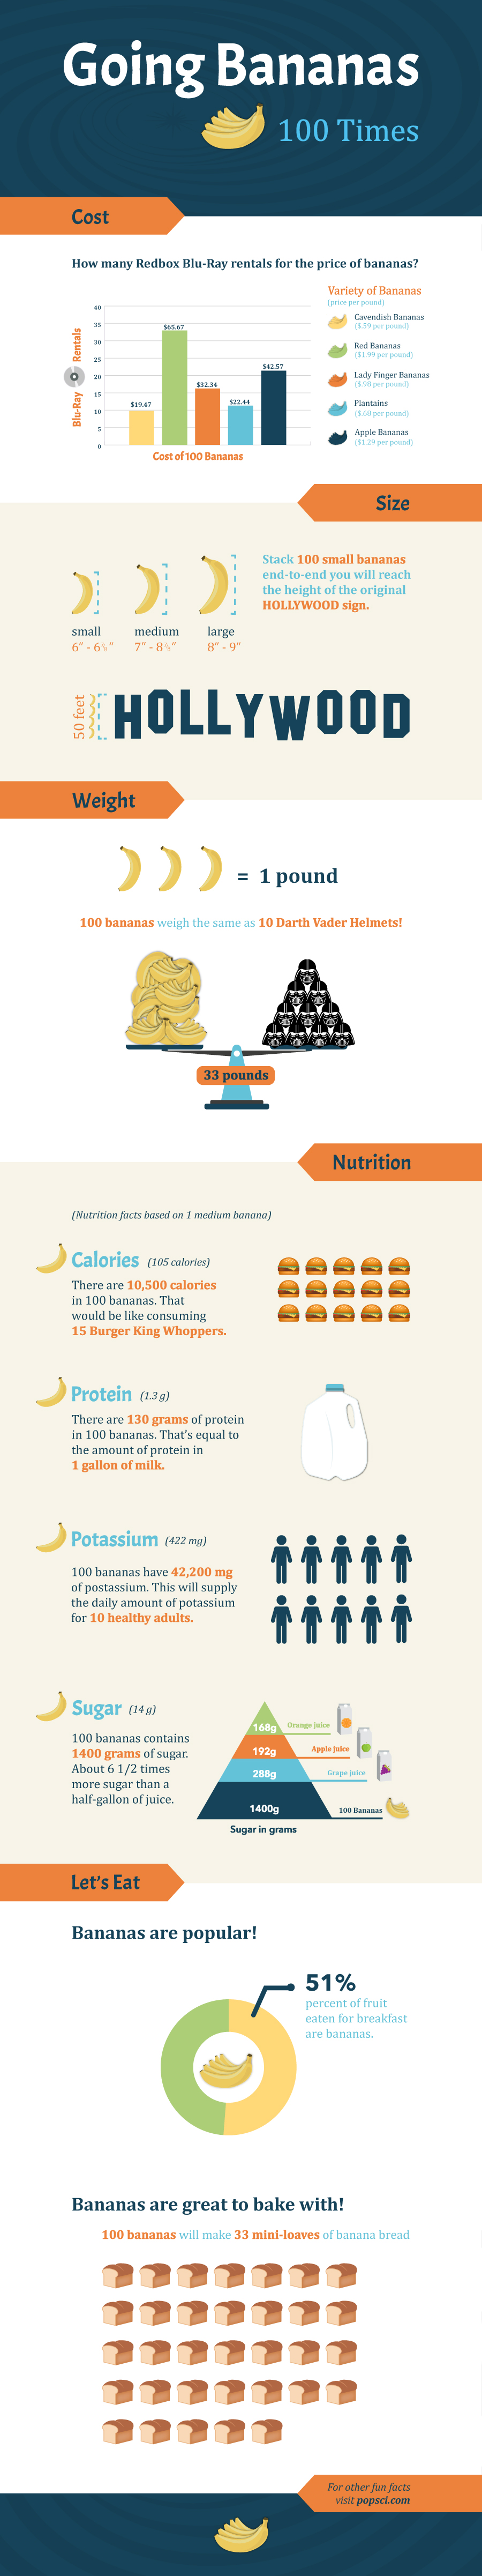
The scope of this project was to create a web infographic to help visualize ways to display an object in a group of 100. The object needed to be measured and compared to other known objects to help the viewer visualize the quantity of the statistics. I chose to demonstrate the cost and nutrition of 100 bananas. The individual facts of a banana were also included along with the facts for the quantity of 100 bananas.
All icons, elements and graphs were created in Illustrator.